Project overview
Clean Air Council was awarded an Azavea 2017 Summer of Maps fellowship program to better understand the state of Philadelphia’s bicycle parking demand, and pinpoint areas in Center City with limited bicycle parking infrastructure, or where the infrastructure did not meet the demand. The project centered on finding variables that could explain the bike parking demand, using employment data, on road bike facilities, Indego trips, and other data. One of the major goals is to be able to predict bike parking demand in other locations, in order to provide appropriate bike parking infrastructure. Data collected from this study will be used to identify gaps in bike parking, and lay the groundwork for interested investment in safe and secure bike parking.
Philadelphia’s 2013 bike rack study, conducted by the Mayor’s Internship Program, created a baseline for bike parking in Center City. The results of the City’s 2013 study found the number of bikes parked on sidewalks exceeded the existing bike rack capacity. The study also revealed formal bike parking was not being utilized on streets with bike racks. Bike parking exceeded demand in some Center City areas while not satisfying demand in other areas.
Data wrangling
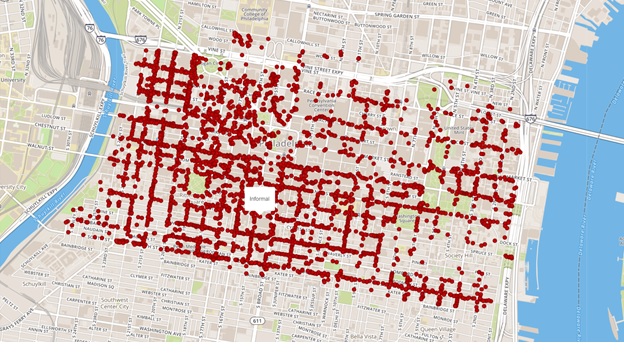
The Council made the most of the opportunity to work with an Azavea fellow with expertise in geospatial data analysis by not only getting in-depth analysis, but also collecting a new round of data. In order to understand the factors that contribute to an area’s bike parking demand, the Council first needed to determine which downtown Philadelphia areas are in most need of bike parking by locating and identifying every existing bike rack in Center City, as well as every bike that is parked in Center City, and whether it is to a rack or another informal structure.
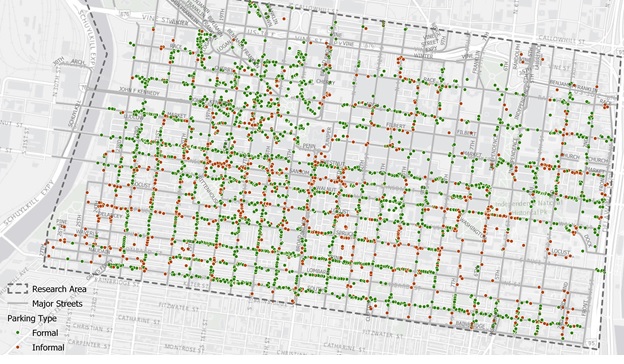
The Council used the Fulcrum app to collect data using cell phones. Staff from Azavea and Clean Air Council used the app to geolocate bikes and bike racks on all streets between the Schuylkill and Delaware Rivers from South Street to Vine Street. Locating formal bike rack parking included differentiating between inverted U/staple racks, bike corrals, and parking meters. The study also documented informal bike parking including bikes locked to railings, trees, poles, scaffolding, and fences. Conflicts that prevented bicycles from correctly locking to a rack, and bike racks appearing damaged or in disrepair were also noted.
The whole process of walking all of center city during daytime, work week hours took 12 staff and volunteers between the two organizations, 6 days, and collected 4,000 data points!
Analysis
Capturing existing bike parking infrastructure allowed Azavea to provide accurate mapping images of bike parking demand. Azavea’s analysis was based on several data sets ranging from census job data to transit station locations to bicycle trip data.
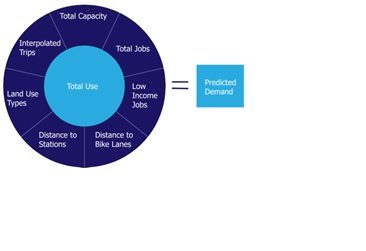
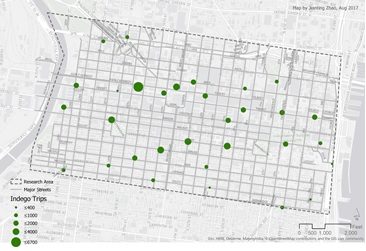
Indego bikeshare’s public data allowed Azavea to look at the number of one-way weekday trips from 7-11am from April through September 2016. This gave a baseline of how many cyclists were travelling to different parts of Center City during work week morning hours. Total number of jobs, in addition to land use, helped identify areas in Center City most likely to host employees commuting by bike. Proximity to bike lanes and distance to train stations were also added factors to the predicted demand equation.
Conclusions
Azavea found a linear regression equation to be the best fit in determining the need for bike parking, while being easy to interpret and able to be written as a formula, Y = β0 + β1X1 + β2X2 + β3X3 + Ɛ. The final list of variables that can be used to predict the demand for bicycle parking include: formal capacity, total jobs, Indego bike trips, commercial consumer land use, commercial business and professional land use, and mixed commercial and residential land use.
In addition to pointing out all over Center City where there is a clear need for increased bike parking infrastructure due to the level of informal bike parking, the model also identifies a few areas that should be looked at more because they show high demand in the model. The study found three areas where eight to ten additional bike parking spaces are needed. These areas include 13th and Market Street around the entrances to the El station, around Liberty Place on Market Street between 17th and 18th Streets and around the department stores near Jefferson Station between Market Street and Filbert Street and from 7th to 10th Streets. The study found the City’s Municipal Services Building, between JFK Boulevard and Arch Street between Broad and 15th Streets, and Jefferson Hospital’s Lubert Plaza between 10th and 11th Streets and between Locust and Walnut Streets to be where bike parking was used the most.
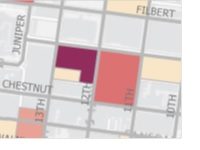
Near 13th Street MFL Station
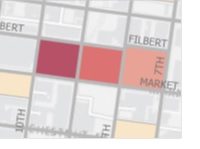
Jefferson Station department stores
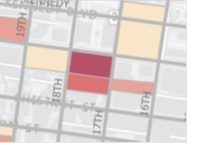
Around Liberty Place
Limitations
This model shows the best correlation between actual use and predicted demand of bike parking, though the model did produce some inaccurate results. In areas shown in dark red, the model over predicted the need for bike parking. In the dark blue areas, the model under predicted demand. It was pointed out by Azavea’s fellow that the census data used was wide in scope for a study as precise as ours. Lastly, the Fulcrum app used to collect bike rack data would sometimes locate racks on the opposite side of the street leading to some inaccuracy.
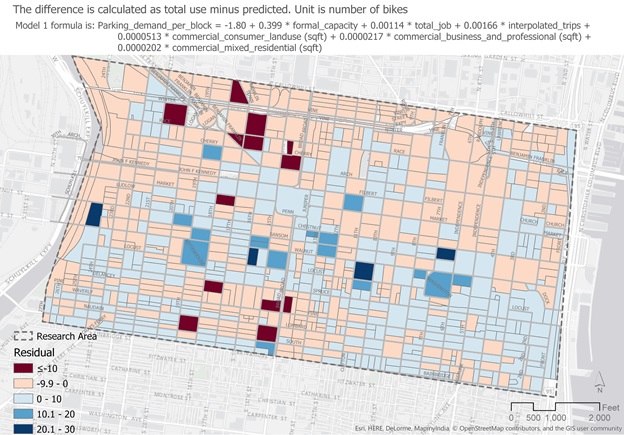
The equation used for this analysis was not tested outside Center City, but the Council hopes to do this in the future. Indego bike trips were used in the final prediction formula making models outside of Indego’s service area inaccurate, but another formula that did not include Indego as a predicting variable was also created so that this could be used in other areas of the city.
